View Dataset Details
Clicking on a dataset name from the Datasets list view opens the chart builder with that dataset preloaded as the Chart Source. This provides a quick shortcut to start building a visualization directly from the dataset without navigating to the Charts screen first.
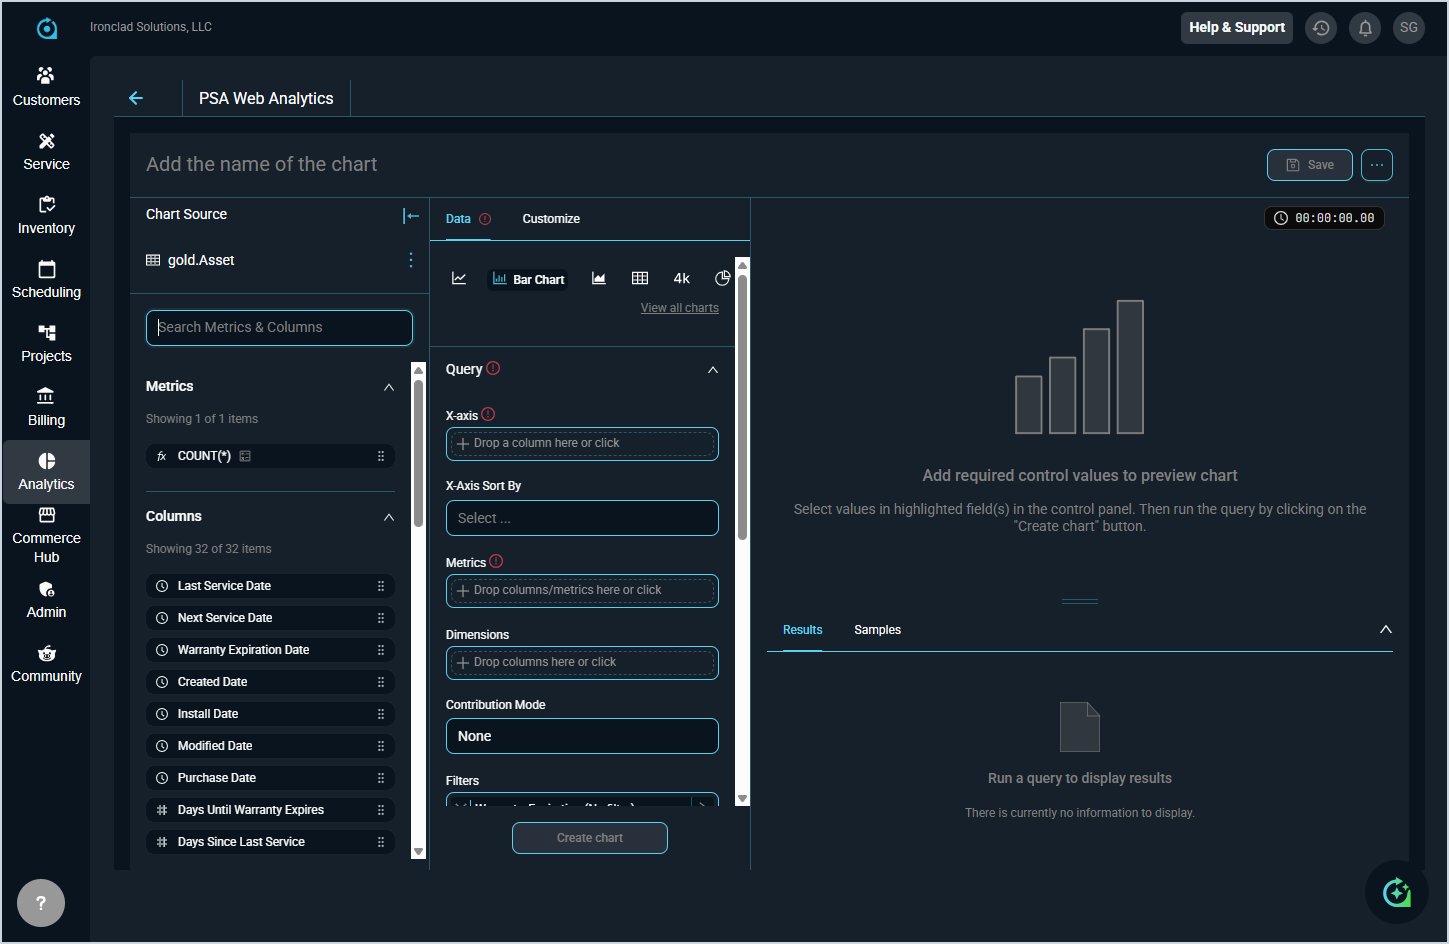
The left panel displays the selected dataset along with all available Metrics and Columns you can use in your chart. Metrics are pre-defined calculations that can be dragged into your query, and columns are the available data fields that can be used as dimensions or filters. The center panel is where you configure your visualization by selecting a query mode, dragging fields into the appropriate areas, and choosing a chart type from the toolbar at the top of the Data tab. When you are ready to preview your chart, click Create chart to generate the visualization.
For detailed information on configuring and saving your chart, see the Add/Edit Charts article.