
View Dashboard Details
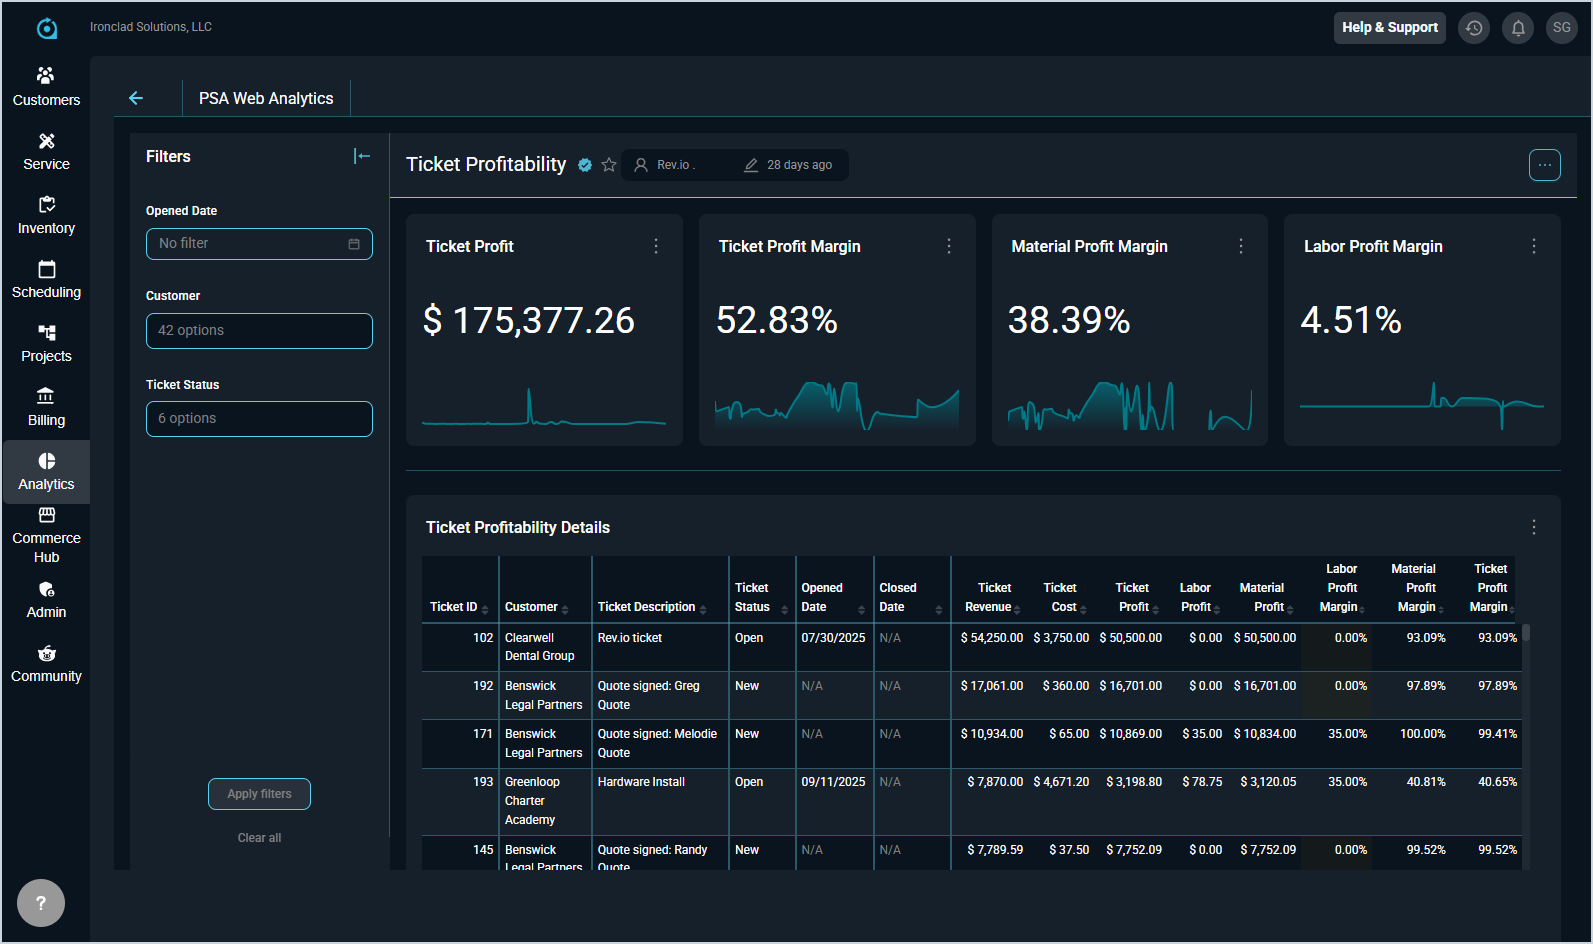
Clicking on a dashboard from the Dashboards list view screen opens the dashboard in more detail. The dashboard may take a few seconds to load as it gathers the most up-to-date, live data from your instance. The Analytics dashboards provide insight into key data across the system, with the information displayed varying depending on the dashboard selected. Most dashboards include a Filters panel on the left side that allows you to refine the data being displayed, summary cards across the top that highlight key metrics at a glance, and a detailed table that lists the underlying records and data supporting those metrics. This layout helps you quickly analyze trends while also allowing you to drill into more specific details.
The following actions are available when viewing dashboard details.
- View additional details and specific values for the summary cards by clicking on the title of the summary card.
- Apply filters using the filters side panel to narrow data by several available filter options. Filters apply to all charts on the dashboard simultaneously.
- Refresh the dashboard by clicking the menu icon on any of the dashboard elements and selecting one of the Refresh options. The dashboard will reload all charts with the latest data from your database.
- Hover over any chart element to see a tooltip with exact values and additional details.
- View the dashboard in full-screen for a closer look by clicking the menu icon and selecting Enter fullscreen.
- Download data displayed on this screen by clicking the menu icon and selecting Download. Generally, data can be exported as a .CSV or .PDF for sharing.
- Share the dashboard with others by clicking the menu icon and selecting Share.
- Set how frequently the dashboard automatically refreshes by clicking the menu icon and selecting Set auto-refresh interval.