
Charts List View
The Charts screen lists every individual visual component available in the Analytics module. While dashboards group charts together by topic, the Charts list screen allows you to browse, create, favorite, and work with individual charts independently. Users with the Create Reports permission can also build new charts from scratch.
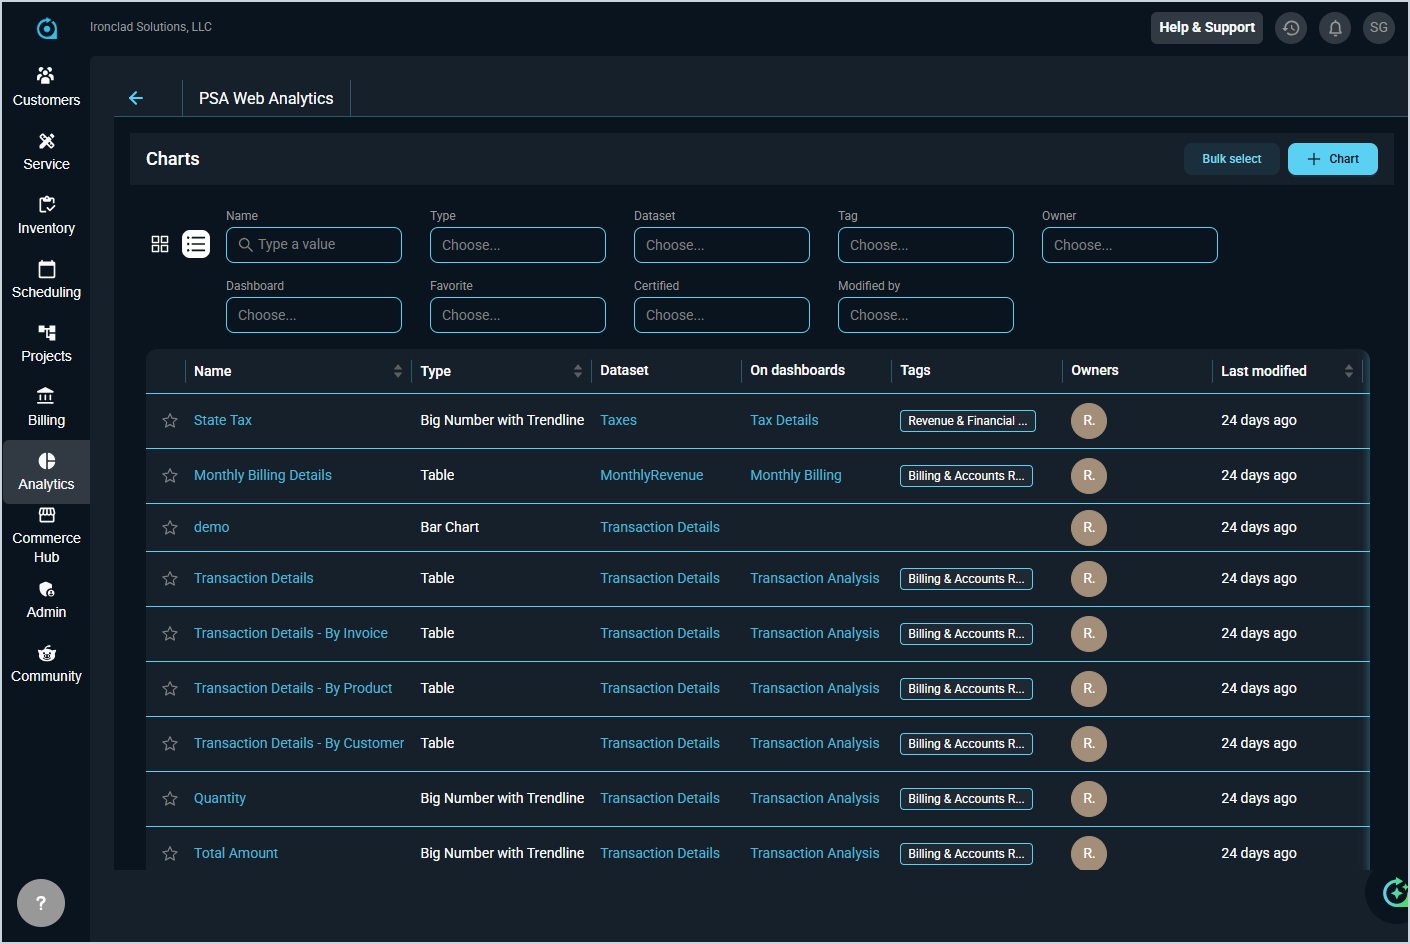
Each field on the Charts list view is defined below.
| No. | Label | Definition |
| 1 | Name | Name of the chart element. |
| 2 | Type | Type of the chart element. See the Chart Type Options article for more information about the available Type options. |
| 3 | Dataset | Name of the dataset where the chart element belongs. |
| 4 | On Dashboards | Names of the dashboards where the chart element exists. |
| 5 | Tags | Tags added to help categorize the chart elements. |
| 6 | Owners | Owner of the chart element. Rev.io is the owner of all elements that come prepopulated in the system. |
| 7 | Last Modified | Time period when the chart element was last modified. |
These actions are available on the Charts list view.
- Set a chart element as a Favorite by clicking the star icon at the start of the row.
- Click the Bulk Select button to enable selecting multiple chart elements to export them or add tags.
- Add a new chart by clicking + Chart in the upper right corner. See the Add/Edit Charts article for more information.
- View the available chart elements as a grid instead of a list by clicking the grid icon below the Charts heading.
- View the available chart elements as a list instead of a grid by clicking the list icon below the Charts heading.
- Filter the chart elements displayed on this view by entering text or selecting specific options in any of the filters above the grid. The list view updates to display elements matching your filters. NOTE: When entering text in a filter, you must click out of the filter or press the Enter key on your keyboard for the results to update.
- Sort the results in the table by clicking the column label in the table header.
- View the chart element by clicking the chart Name. See the View Chart Details article for more information.