Integrations Library: Executions Tab
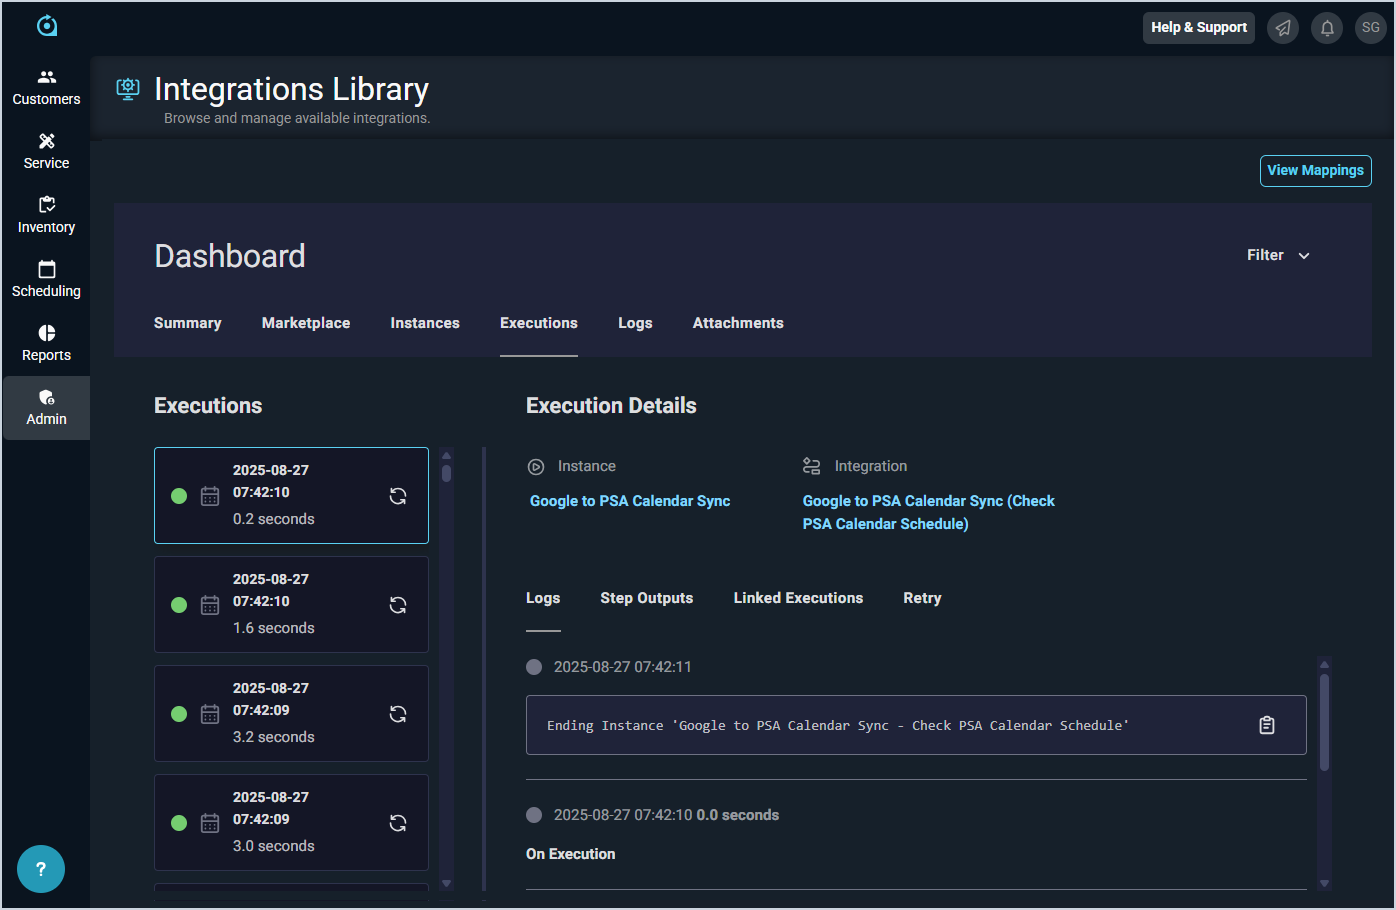
The Executions tab allows you to review the log for each time any of your integrations run or execute in your environment. This tab includes two main sections: the Executions pane and the Execution Details area. The Executions pane displays a log of each execution with the date, time, and duration of the execution. A green circle indicates that the execution was successful and a gray circle indicates that the execution is still in progress.
Clicking any item in the Executions pane opens the execution in more detail in the Execution Details area. In the Execution Details area, you can inspect execution logs and review the results of each step of the execution, which is useful for support and debugging purposes.
You can also filter the executions displayed on this tab to only show items that match certain criteria. To do so, simply click the Filter option at the top of the screen and select the options you want to use for filtering. The Executions pane will update to show only executions that match the criteria entered.
| NOTE: This tab only displays for users with the Manage integrations permission on the Prismatic Integrations permissions tab. |