Integrations Library: Logs Tab
The Logs tab allows you to review the log for all integration activity in your environment. The log shows a Timestamp, Log Type, Flow, Instance, and Message for each entry. You can review the logs by simply scrolling through the options, clicking the column headings to sort the information, or using the Search logs field at the top of the screen.
You can also filter the items displayed to only show logs that match certain criteria. To do so, simply click the Filter option at the top of the screen and enter a Log Type, Time Range, Log Severity, or Instance to use for filtering. The log will update to show only entries that match the criteria entered.
| NOTE: This tab only displays for users with the Manage integrations permission on the Prismatic Integrations permissions tab. |
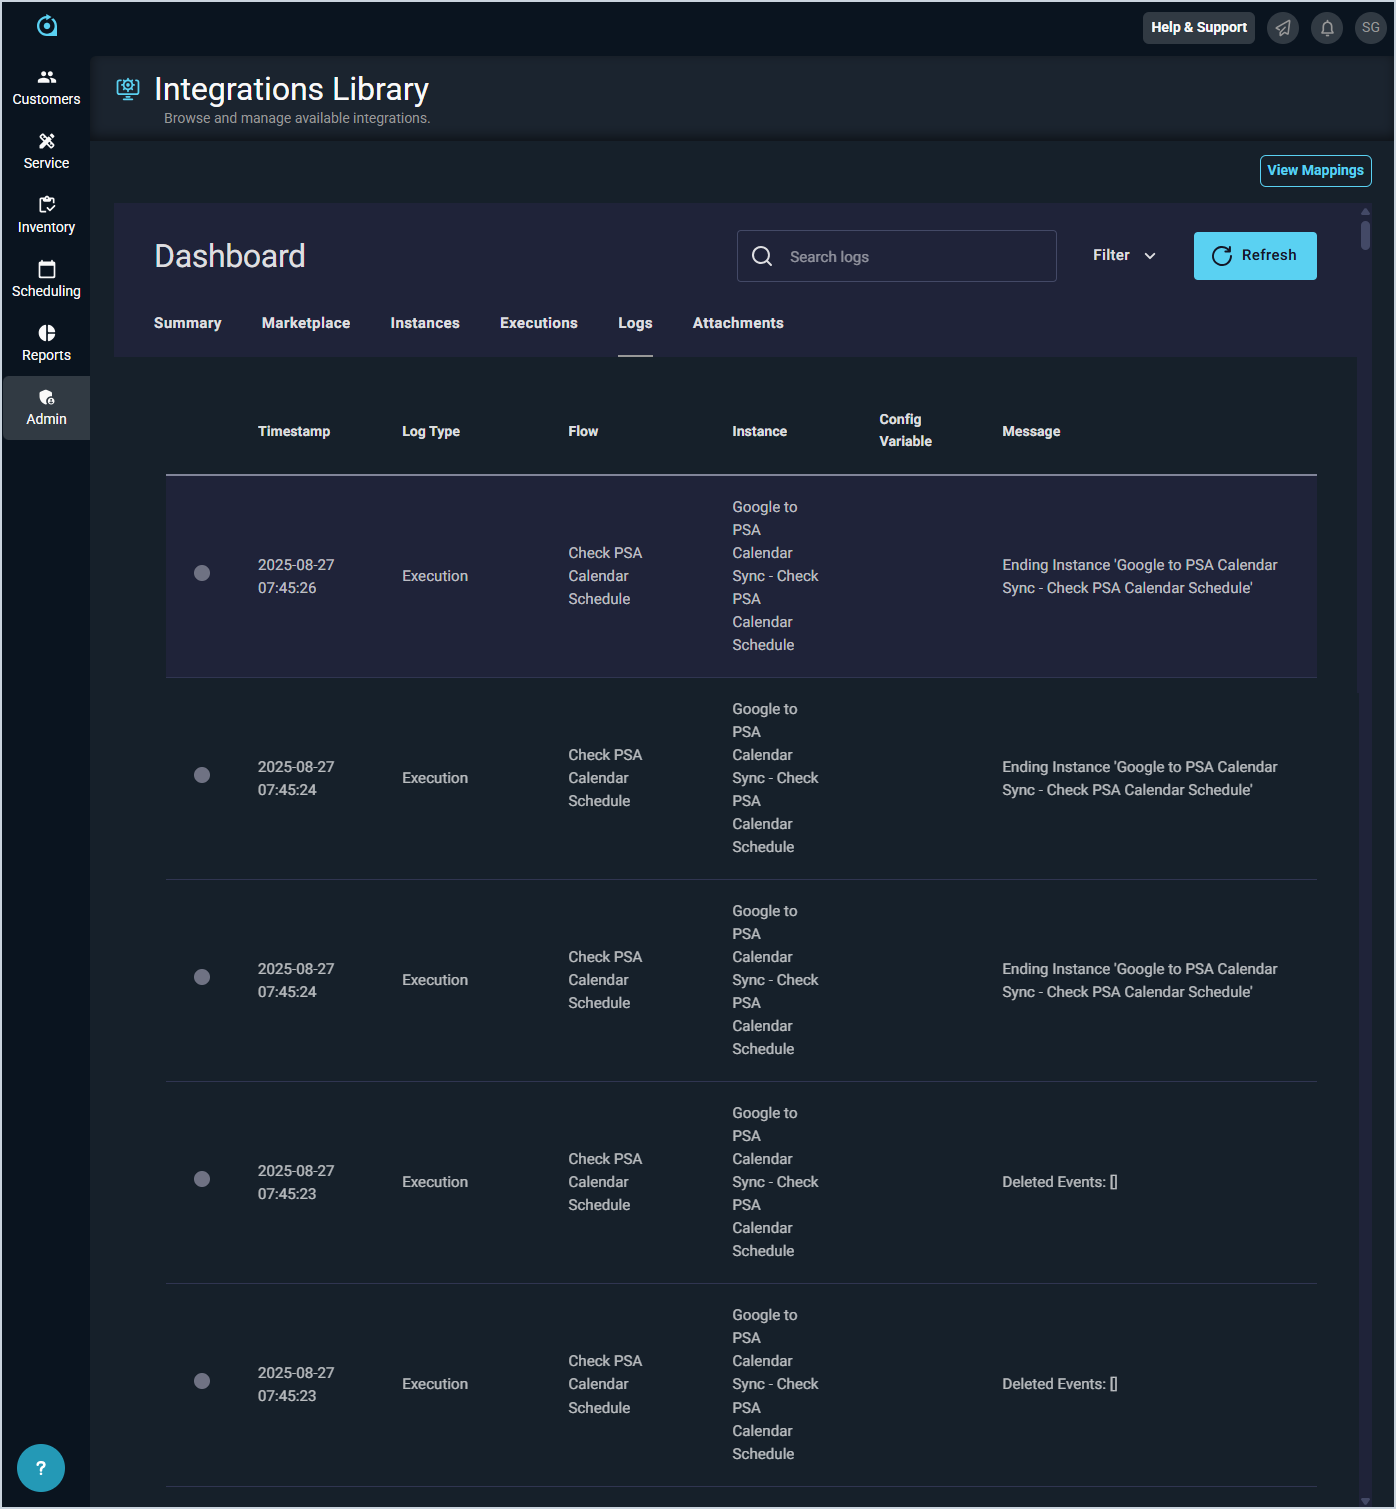
Each area on the Logs tab is defined below.
| No. | Label | Definition |
| 1 | Timestamp | Date and time of the log entry. |
| 2 | Log Type | Type for the log entry. |
| 3 | Flow | Description of the flow of information for the log entry. |
| 4 | Instance | Instance or integration of the log entry. |
| 5 | Config Variable | Config variable for the log entry. |
| 6 | Message | Message or description of the log entry. |
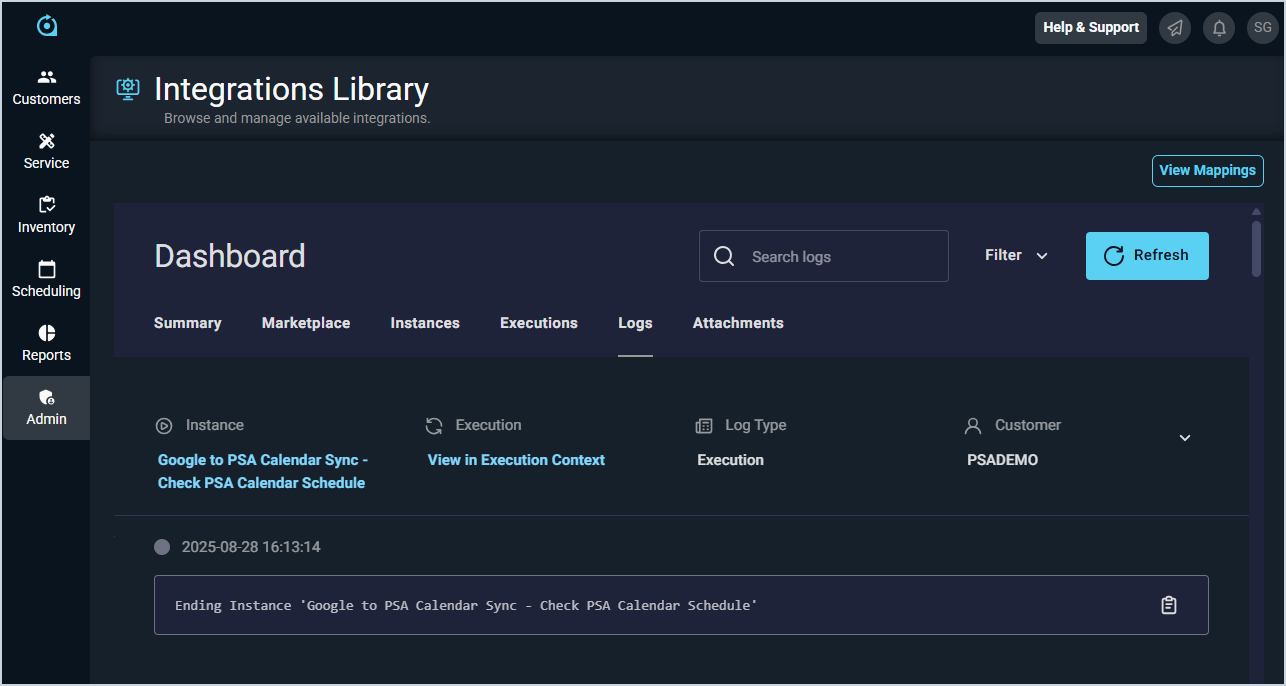
Clicking on any entry on the Logs tab displays more details for the log entry. You can view more details about the integration instance or the execution itself by clicking the links in the Instance and Execution fields.