
View Chart Details
Clicking on a chart from the Charts list view opens it in detail. The chart may take a few seconds to load as it pulls the most up-to-date data from your system. Each chart is built on a data source and displays your selected metrics in the visualization type assigned to it.
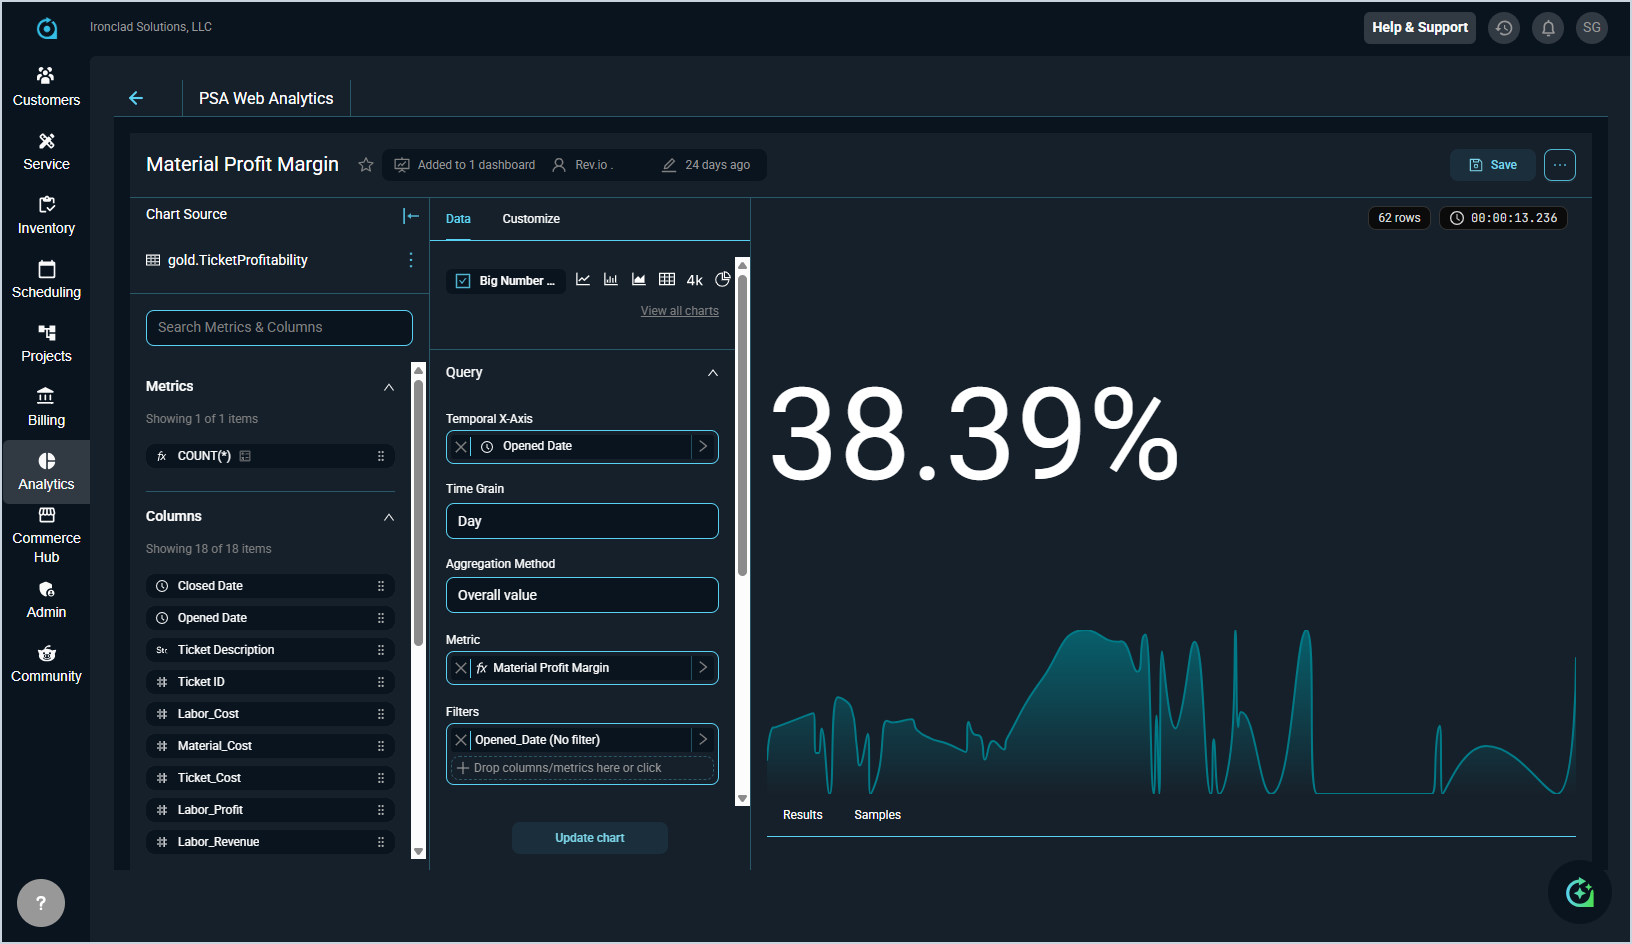
The chart view is divided into three main areas. On the left is the Chart Source panel, which shows the dataset powering the chart along with the available metrics and columns you can work with. In the middle are the Data and Customize tabs, where you can adjust the query settings, such as time range, filters, and aggregation method, and update how the chart looks. On the right, the Results and Samples tabs allow you to preview the underlying data behind the visualization, giving you a closer look at the records and values driving the chart.
The following actions are available when viewing chart details.
- Add the chart to your favorites by clicking the star icon next to the chart name.
- View the dashboards the chart appears on by clicking the menu icon and selecting On dashboards.
- Download the chart by clicking the menu icon and selecting Download.
- Share the chart with others by clicking the menu icon and selecting Share.
- Manage scheduled email delivery of the chart by clicking the menu icon and selecting Manage email report.
- View the underlying query powering the chart by clicking the menu icon and selecting View query.
- Open and run the chart query directly in SQL Lab by clicking the menu icon and selecting Run in SQL Lab.
- Save changes to the chart by clicking Save in the upper right corner.
- Switch the visualization type by selecting a different chart type from the options displayed at the top of the Data tab.
- Update the chart query by adjusting the settings in the Query section, including the Temporal X-Axis, Time Grain, Aggregation Method, Metric, and Filters fields.
- Customize the appearance of the chart by clicking the Customize tab and adjusting the available display options.
- Preview the underlying data behind the chart by clicking the Results or Samples tabs at the bottom of the chart view.